Discover HKBU
Hotspot map visualises real-time distribution of COVID-19 cases
14 Nov 2022
Mastering timely and accurate information on the geographic distribution of COVID-19 infection cases is important for health authorities to implement effective infection control measures and allocation of medical resources. Such information is also useful for the public in understanding the health risks they are facing.
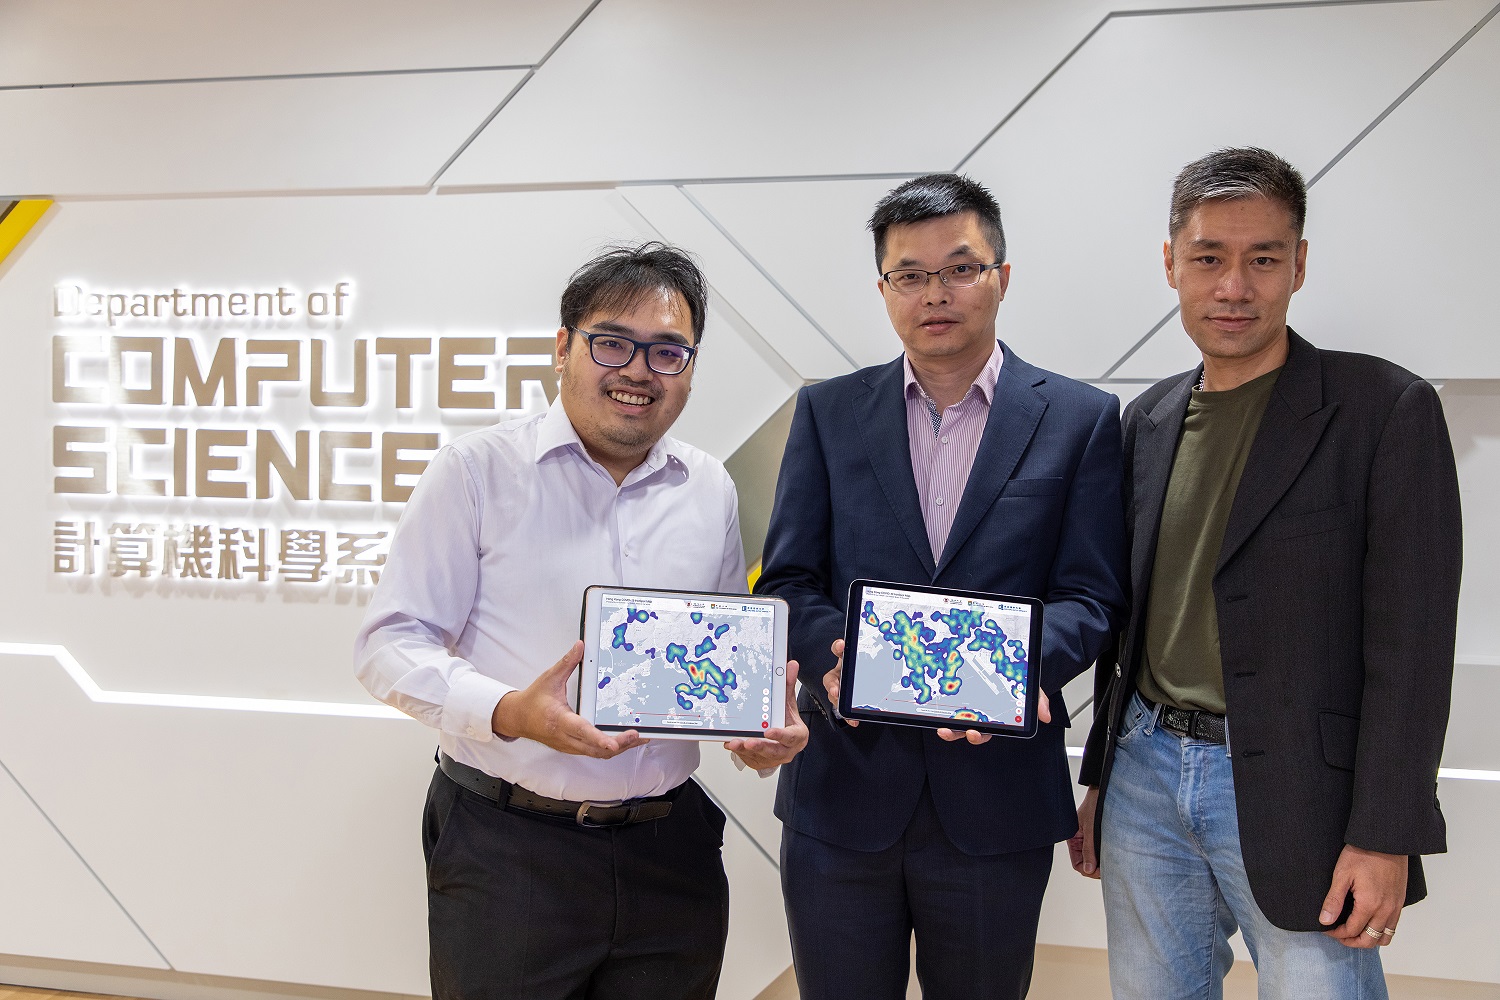
To this end, a research team led by Professor Xu Jianliang, Head of the Department of Computer Science at HKBU, developed the Hong Kong COVID-19 Hotspot Map, which allows the intuitive visualisation of real-time and dynamic geographic distribution of COVID-19 cases in Hong Kong. The Map is supported by novel computation methods of big spatial-temporal data developed by the team with substantially enhanced resolution and speed in visualisation results output.
New computation methods enhance big data processing capability
Real-time data represented in the Map comes from the Interactive Map Dashboard maintained by the Government. COVID-19 infection risks in different geographical areas, in terms of the abundance of COVID-19 cases, are shown in a colour scheme, ranging from purple for the lowest risk level to red for the highest. Evolving risk levels of locations visited by infected persons in the past seven days are visible through the dynamic movement of colour patterns on the Map. Users can zoom-in or zoom-out to browse the COVID-19 risk levels at broader or more specific geographical locations.
The colour visualisation of COVID-19 risk levels on the Map is based on the automatic, real-time updating and computation of infection case data. A computational tool for spatial-temporal data analysis named Kernel Density Visualisation (KDV) is used to support the visual creation. However, many statistics, geographical and visualisation software tools cannot support high-resolution KDV with million-scale datasets as required by the Map. Furthermore, computation methods of conventional KDV cannot support the real-time creation of dynamic images.
To tackle this problem, the research team developed new computation methods with the application of complexity-optimised theory. The new computation methods work together with a progressive visualisation framework to create continuous partial visualisation outputs, so that response time of KDV can be reduced. Experiments with large-scale datasets showed that response time using the new computation methods is 100 times faster than the most advanced methods currently available. Relevant research results were released in the “ACM International Conference on Management of Data” and “International Conference on Very Large Data Bases”, two top international conferences in the area of big data management held this year.
Using the new computation methods, resolution of the Map can be increased to 1376 x 960 pixels (high definition resolution). A response time of less than 0.5 second in processing one million data points can also be achieved, which substantially out-performs other existing tools.
Monitoring COVID-19 risks in the community
Professor Xu says: “The newly developed algorithms and solutions can support more KDV-based geospatial analysis tasks. With their application, the functionalities of the Hong Kong COVID-19 Hotspot Map were greatly enhanced, making it a useful tool to monitor the risks of COVID-19 in the community. It can assist health authorities as well as individual citizens in introducing informed, effective measures against the pandemic.”
The research team include Professor Byron Choi, Associate Head and Dr Chan Tsz-nam, Research Assistant Professor of the Department of Computer Science, as well as researchers from the University of Macau and The University of Hong Kong. The team is also exploring other potential application of the new computation methods in support of KDV such as traffic hotspots detection, crowd control in tourist attractions, property prices visual analysis and real-time weather resources management. The breakthrough paves the way for fully utilising KDV in other research areas in the future.